The Importance of Logging in DevOps

In the labyrinth of DevOps, where swift releases and robust systems are crucial, logging stands as a beacon of clarity. Let's explore this intricate realm, dissecting every minute detail of logging in DevOps.
Example: Imagine being aboard a giant ship at night, sailing through unknown waters. In the absence of a lighthouse, you'd be completely lost. In the intricate universe of DevOps, logging is that lighthouse, ensuring we never lose our way.
I. Unraveling the Concept of Logging
Logging is the act of recording messages, events, or notifications from software applications and systems, called logs. These logs paint a comprehensive picture of system operations, behavior, and potential issues.
At its core, logging is the software world's equivalent of a ship's captain making timely entries into a logbook.
Example: A coffee shop's POS system logs when it starts up, a sale is made, or even if an error pops up when processing a card.
II. Importance of Logging in DevOps
In DevOps, a streamlined software delivery process is paramount. Logs come into play for:
Real-time Monitoring:
Keep a watchful eye on systems and applications as events unfold. It's akin to a doctor checking a patient's vitals.
Example: An e-commerce website tracking user actions in real-time, observing how many are adding items to the cart, how many are checking out, and if there are any issues during this process.
Troubleshooting:
The first resort when anomalies arise, logs help in tracing problems. The detective work when something goes amiss.
Example: An online payment gateway failing to process transactions. Logs would indicate if the problem was due to server overload, a third-party service failure, or database issues.
Performance Analysis:
Logs highlight performance bottlenecks. The regular health checkup of an application.
Example: A gaming app analyzing logs to determine the levels most players are getting stuck at, indicating perhaps a bug or too high a difficulty.
Security and Compliance:
For auditing and regulatory adherence, logs are indispensable. The security cameras of the software realm.
Example: Detecting multiple failed login attempts from a single IP, suggesting a possible brute force attack.
Feedback Loop:
Informing continuous improvement, logs play a crucial role in CI/CD pipelines. Crucial for the continuous improvement aspect of DevOps.
Example: After deploying a new feature, logs showing increased system memory consumption might prompt developers to optimize the feature in the next iteration.
III. Best Practices: Logging in DevOps Demystified

Structured Logging:
Concept: Logging in a standardized, often machine-readable format.
Definition: Using a standardized format (like JSON or XML) for logs.
Benefits: Enhances readability, simplifies parsing, and streamlines analysis.
Implementation: Adopt logging libraries/frameworks such as Serilog (for .NET) or logrus (for Go) which support structured logging.
Example: Instead of "User Mike made a purchase of $50 on 25th Aug", structured logging would record:
{"event": "purchase", "user": "Mike", "amount": 50, "date": "2023-08-25"}.
Centralized Logging:
Concept: All logs, from every nook and corner, come together in one central repository.
Definition: Collating logs from disparate sources into a singular platform.
Benefits: Unified viewpoint, streamlined analysis, and efficient monitoring.
Implementation: Platforms like the ELK Stack, Graylog, and Splunk serve this purpose. Use agents or shippers like Filebeat or Fluentd to funnel logs to these platforms.
Example: A cloud-based service that aggregates logs from a website's frontend, backend, and databases, giving a 360-degree view.
Log Levels:
Concept: Logs can be prioritized based on their severity.
Definition: Categorizing logs based on their importance or severity.
Types:
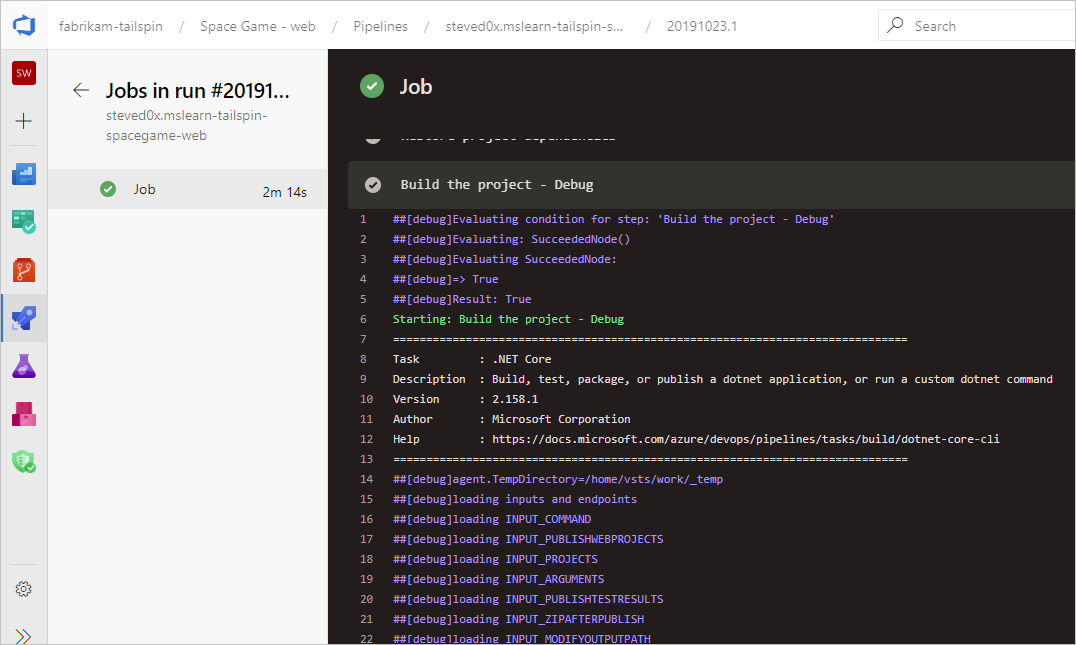
DEBUG: Detailed information for debugging.
INFO: General informational messages.
WARN: Potentially harmful situations.
ERROR: Errors denoting some failure.
CRITICAL: Severe error events.
Implementation: Most logging libraries provide methods corresponding to these levels. Use them judiciously to categorize messages.
Example:
INFO: "User logged in".
ERROR: "Database connection failed".
DEBUG: "API call parameters: {...}".
Log Rotation and Retention:
Concept: Just as a librarian archives old books, logs are periodically archived or deleted.
Definition: Process of archiving or deleting outdated logs.
Benefits: Efficient storage management and compliance.
Implementation: Use tools like logrotate or in-built features in logging platforms to define rotation policies based on age, size, or both.
Example: Configuring a system to retain error logs for a year but general info logs for only a month.
Log Security:
Concept: With the possibility of sensitive information in logs, their security is paramount.
Encryption: Protect logs in transit (using TLS) and at rest (using AES or similar encryption).
Access Control: Implement Role-Based Access Control (RBAC) to ensure only authorized individuals access logs.
Auditability: Ensure logging systems themselves generate logs, capturing any access or modifications.
Example: Masking or encrypting sensitive data like user passwords or credit card numbers.
IV. The Toolbox: Logging Tools and Platforms
ELK Stack:
What's Inside?:
Elasticsearch: The engine that helps you search through vast amounts of log data.
Logstash: The gatherer, collecting logs from various sources.
Kibana: The lens, providing a visual interface to your logs.
Configuration: YAML-based configuration files.
Example Use-case: An online store using ELK to visualize customer activity during a Black Friday sale, ensuring smooth operations.
Splunk:
Attributes: A versatile, end-to-end solution for all things logs.
Description: Proprietary platform for log collection and analysis.
Installation: Offers both on-premises and cloud solutions.
Features: Advanced analytics, machine learning capabilities, and extensive integrations.
Splunk Query Language (SPL): Powerful querying for in-depth analysis.
Example Use-case: A financial institution setting up real-time fraud detection alerts using Splunk, based on transactional logs.
Graylog:
Attributes: Built atop Elasticsearch, it's an open-source, robust log management solution.
Based On: Elasticsearch for storage and MongoDB for metadata.
Features: Dashboards, alerting, and a rich set of integrations.
Setup: Offered as OVA, Docker, and more.
Example Use-case: An IT company using Graylog to monitor the health of its infrastructure, tracking everything from server uptimes to application crashes.
Loki:
Attributes: Designed for the cloud-native ecosystem, it’s optimized for environments like Kubernetes.
Inspiration: Promoted as "Prometheus, but for logs."
Setup: Integrates seamlessly with Grafana for visualization.
Storage: Loki indexes just metadata, not the content, ensuring efficiency.
Example Use-case: A SaaS company employing Loki to manage logs from its multitude of microservices running on Kubernetes clusters.
Fluentd:
Attributes: The bridge between your application and the logging platform.
Nature: Open-source data collector.
Features: Lightweight, with over 700 plugins.
Deployment: Versatile, with options for bare metal, Docker, or Kubernetes.
Example Use-case: A mobile app company using Fluentd to funnel logs from its apps across the globe to its central logging system.
V. Integrating Logging into DevOps Pipelines

Logs aren't just passive records. They're active agents that can and should influence DevOps processes.
Continuous Integration: Using logs to identify why a particular build failed.
Continuous Delivery: Reviewing logs to confirm that a release candidate is ready for production.
Continuous Monitoring: Setting up automated alerts based on specific log patterns.
VI. The Road Ahead: Future Trends
AI-powered Log Analysis: Using machine learning to predict and detect anomalies even before they become apparent.
Edge Logging: With the rise of IoT, managing logs from edge devices will become crucial.
Conclusion
In the multifaceted ecosystem of DevOps, logging emerges as the unsung hero, silently safeguarding, informing, and guiding our every step. Through this in-depth exploration, we've unearthed not just the mechanics of logging, but its soul. Like the careful annotations on a mariner's map, logs help navigate the vast, unpredictable oceans of software development and operations. They are not mere strings of data, but the narratives of our applications, telling tales of performance peaks, troubleshooting trenches, and real-time revelations. As we continue our journey in the DevOps world, may we always recognize and harness the power of logs, ensuring our ship remains on course, come what may. With the right knowledge, tools, and practices, logging can transcend its technical trappings to become a beacon of clarity in the intricate dance of DevOps.

Thank you for reading this Blog. Hope you learned something new today! If you found this blog helpful, please like, share, and follow me for more blog posts like this in the future.
If you have some suggestions I am happy to learn with you.
I would love to connect with you on LinkedIn
Meet you in the next blog....till then Stay Safe ➕ Stay Healthy
#HappyLearning #devops #DevOpsDeepDive #LoggingEssentials #LogLife #TechInsights #DevOpsTools #ELKStack #SplunkMagic #GraylogGuide #KubernetesLogs #ContinuousLogging #SecureLogging #TroubleshootWithLogs #PerformanceMonitoring #RealTimeLogs #LogBestPractices


