Datadog Unleashed: Elevate Your Tech Stack with Seamless Azure Integration and Advanced Analytics
Table of contents
- Introduction to Datadog
- Integration of Datadog with Azure
- Prerequisites
- Step-by-Step Integration Process
- Step 1: Setting up Datadog in Azure Marketplace
- Step 2: Configure Datadog Resource in Azure
- Step 3: Install the Datadog Agent on Azure Resources
- Step 4: Configure the Datadog Agent
- Step 5: Start the Datadog Agent
- Step 6: Connect Datadog and Azure
- Step 7: Set Up Monitoring and Alerts
- Advanced Monitoring in Datadog for Azure Infrastructure
- Monitoring Strategies
- Troubleshooting and Optimization
- Conclusion
Introduction to Datadog

Datadog is a monitoring and analytics platform that provides full-stack observability across an entire technology stack—allowing developers, operations, and security teams to develop, deploy, and maintain applications more efficiently and with higher quality. It brings together metrics, traces, and logs from applications, networks, and systems, enabling users to see their data in real time, gather insights, and respond quickly to changes.
Datadog Features
Real-time Dashboards: Offers customizable, real-time dashboards.
Full API Access: Provides extensive API access for custom integrations and automations.
Tracing: Facilitates detailed inspection of application performance and errors.
Machine Learning-Based Alerts: Offers anomaly and outlier detection.
Log Management: Aggregates and analyzes logs from different sources.
Synthetic Monitoring: Monitors application availability and user experience.
Network Performance Monitoring: Provides insights into network dependencies and bottlenecks.
Core Components of Datadog
Agents: Software that collects data from hosts and sends it to Datadog.
Integrations: Plugins or built-in configurations for connecting Datadog with various services.
APIs: Used for custom integrations and interactions with Datadog services.
Dashboards: Visual displays of data and insights collected by Datadog.
Integration of Datadog with Azure

Azure, Microsoft's cloud computing service, can be integrated seamlessly with Datadog to monitor infrastructure and gain deep insights into application performance, user experience, and security.
Prerequisites
Azure Subscription
Datadog Account
Azure CLI or PowerShell
Step-by-Step Integration Process
Step 1: Setting up Datadog in Azure Marketplace
Navigate to the Azure Marketplace and search for Datadog. Select the appropriate Datadog plan and create a Datadog resource.
az login
az account set --subscription "<Your Azure Subscription ID>"
Step 2: Configure Datadog Resource in Azure
After creating the Datadog resource, navigate to it and fill in the necessary information including the Datadog API Key, which can be obtained from the Datadog app’s Integration -> APIs page.
Step 3: Install the Datadog Agent on Azure Resources
To monitor Azure resources, you need to install the Datadog Agent on them.
# For Ubuntu
DD_AGENT_MAJOR_VERSION=7 DD_API_KEY=<Your Datadog API Key> DD_SITE="datadoghq.com" bash -c "$(curl -L https://raw.githubusercontent.com/DataDog/datadog-agent/master/cmd/agent/install_script.sh)"
Step 4: Configure the Datadog Agent
After installation, configure the Datadog Agent to collect data from Azure services. Navigate to /etc/datadog-agent/datadog.yaml and add the appropriate configurations.
api_key: <Your Datadog API Key>
site: datadoghq.com
logs_enabled: true
Step 5: Start the Datadog Agent
Once configured, start the Datadog Agent.
sudo service datadog-agent start
Step 6: Connect Datadog and Azure
Navigate to the Datadog app’s Integration -> Azure page, and connect your Azure account by following the on-screen instructions.
Step 7: Set Up Monitoring and Alerts
Create dashboards, set up alerts, and configure other monitoring options within the Datadog app to start monitoring your Azure infrastructure.
# Example Alert Configuration
type: metric alert
query: "avg(last_5m):avg:azure.vm.cpu_usage{*} by {host} > 80"
name: "[{{host.name}}] High CPU Usage"
message: "The CPU usage is above 80% on host {{host.name}}. Investigate the issue."
tags: ['environment:production', 'service:webapp']
options:
  notify_no_data: false
  no_data_timeframe: 10
Advanced Monitoring in Datadog for Azure Infrastructure

1. Service Monitoring
Service Map: Use Datadog to visualize service dependencies within your Azure environment to understand the interaction between different services and identify bottlenecks.
Service-Level Objectives (SLOs): Define, monitor, and manage SLOs for your Azure services to ensure reliability and availability.
2. Advanced Analytics
Machine Learning: Utilize Datadog’s machine learning features to forecast future usage and detect anomalies in Azure resources.
Advanced Querying: Use Datadog’s extensive querying capabilities to analyze and visualize complex datasets from Azure.
3. Log Management
Live Tail: Stream logs in real-time from your Azure resources.
Log Processing & Analysis: Use Datadog’s Log Management to process and analyze logs from Azure services, enabling deeper insights and quicker troubleshooting.
Log Metrics: Transform log data into metrics for more granular monitoring and alerting.
Example: Azure Event Hubs to Datadog Log Integration:
Azure logs can be forwarded to Datadog using Azure Event Hubs.
Create an Event Hub using Azure CLI
az eventhubs eventhub create --name <Your Event Hub Name> --namespace-name <Your Namespace> --resource-group <Your Resource Group> --message-retention 1 --partition-count 2Set up a Datadog function to consume logs from the Event Hub
First, add the necessary NuGet packages to your project:
  dotnet add package Azure.Messaging.EventHubs
  dotnet add package Azure.Messaging.EventHubs.Processor
//Code to consume logs from Azure Event Hub using Azure.Messaging.EventHubs; using Azure.Messaging.EventHubs.Consumer; using Azure.Messaging.EventHubs.Processor; using Azure.Storage.Blobs; using System; using System.Text.Json; using System.Threading.Tasks; class Program { private const string ehubNamespaceConnectionString = "<Your Event Hubs namespace connection string>"; private const string eventHubName = "<Your Event Hub name>"; private const string blobStorageConnectionString = "<Your Blob Storage connection string>"; private const string blobContainerName = "<Your Blob Container name>"; static async Task Main() { string consumerGroup = EventHubConsumerClient.DefaultConsumerGroupName; BlobContainerClient storageClient = new BlobContainerClient(blobStorageConnectionString, blobContainerName); EventProcessorClient processor = new EventProcessorClient(storageClient, consumerGroup, ehubNamespaceConnectionString, eventHubName); async Task ProcessEventHandler(ProcessEventArgs eventArgs) { try { string logData = eventArgs.Data.EventBody.ToString(); Console.WriteLine($"Received log: {logData}"); await eventArgs.UpdateCheckpointAsync(eventArgs.CancellationToken); } catch (Exception ex) { Console.WriteLine($"Error processing message: {ex.Message}"); } } processor.ProcessEventAsync += ProcessEventHandler; processor.ProcessErrorAsync += (args) => Task.CompletedTask; await processor.StartProcessingAsync(); Console.WriteLine("Press [Enter] to stop processing."); Console.ReadLine(); Console.WriteLine("Stopping the processor..."); await processor.StopProcessingAsync(); } }
4. Custom Dashboards
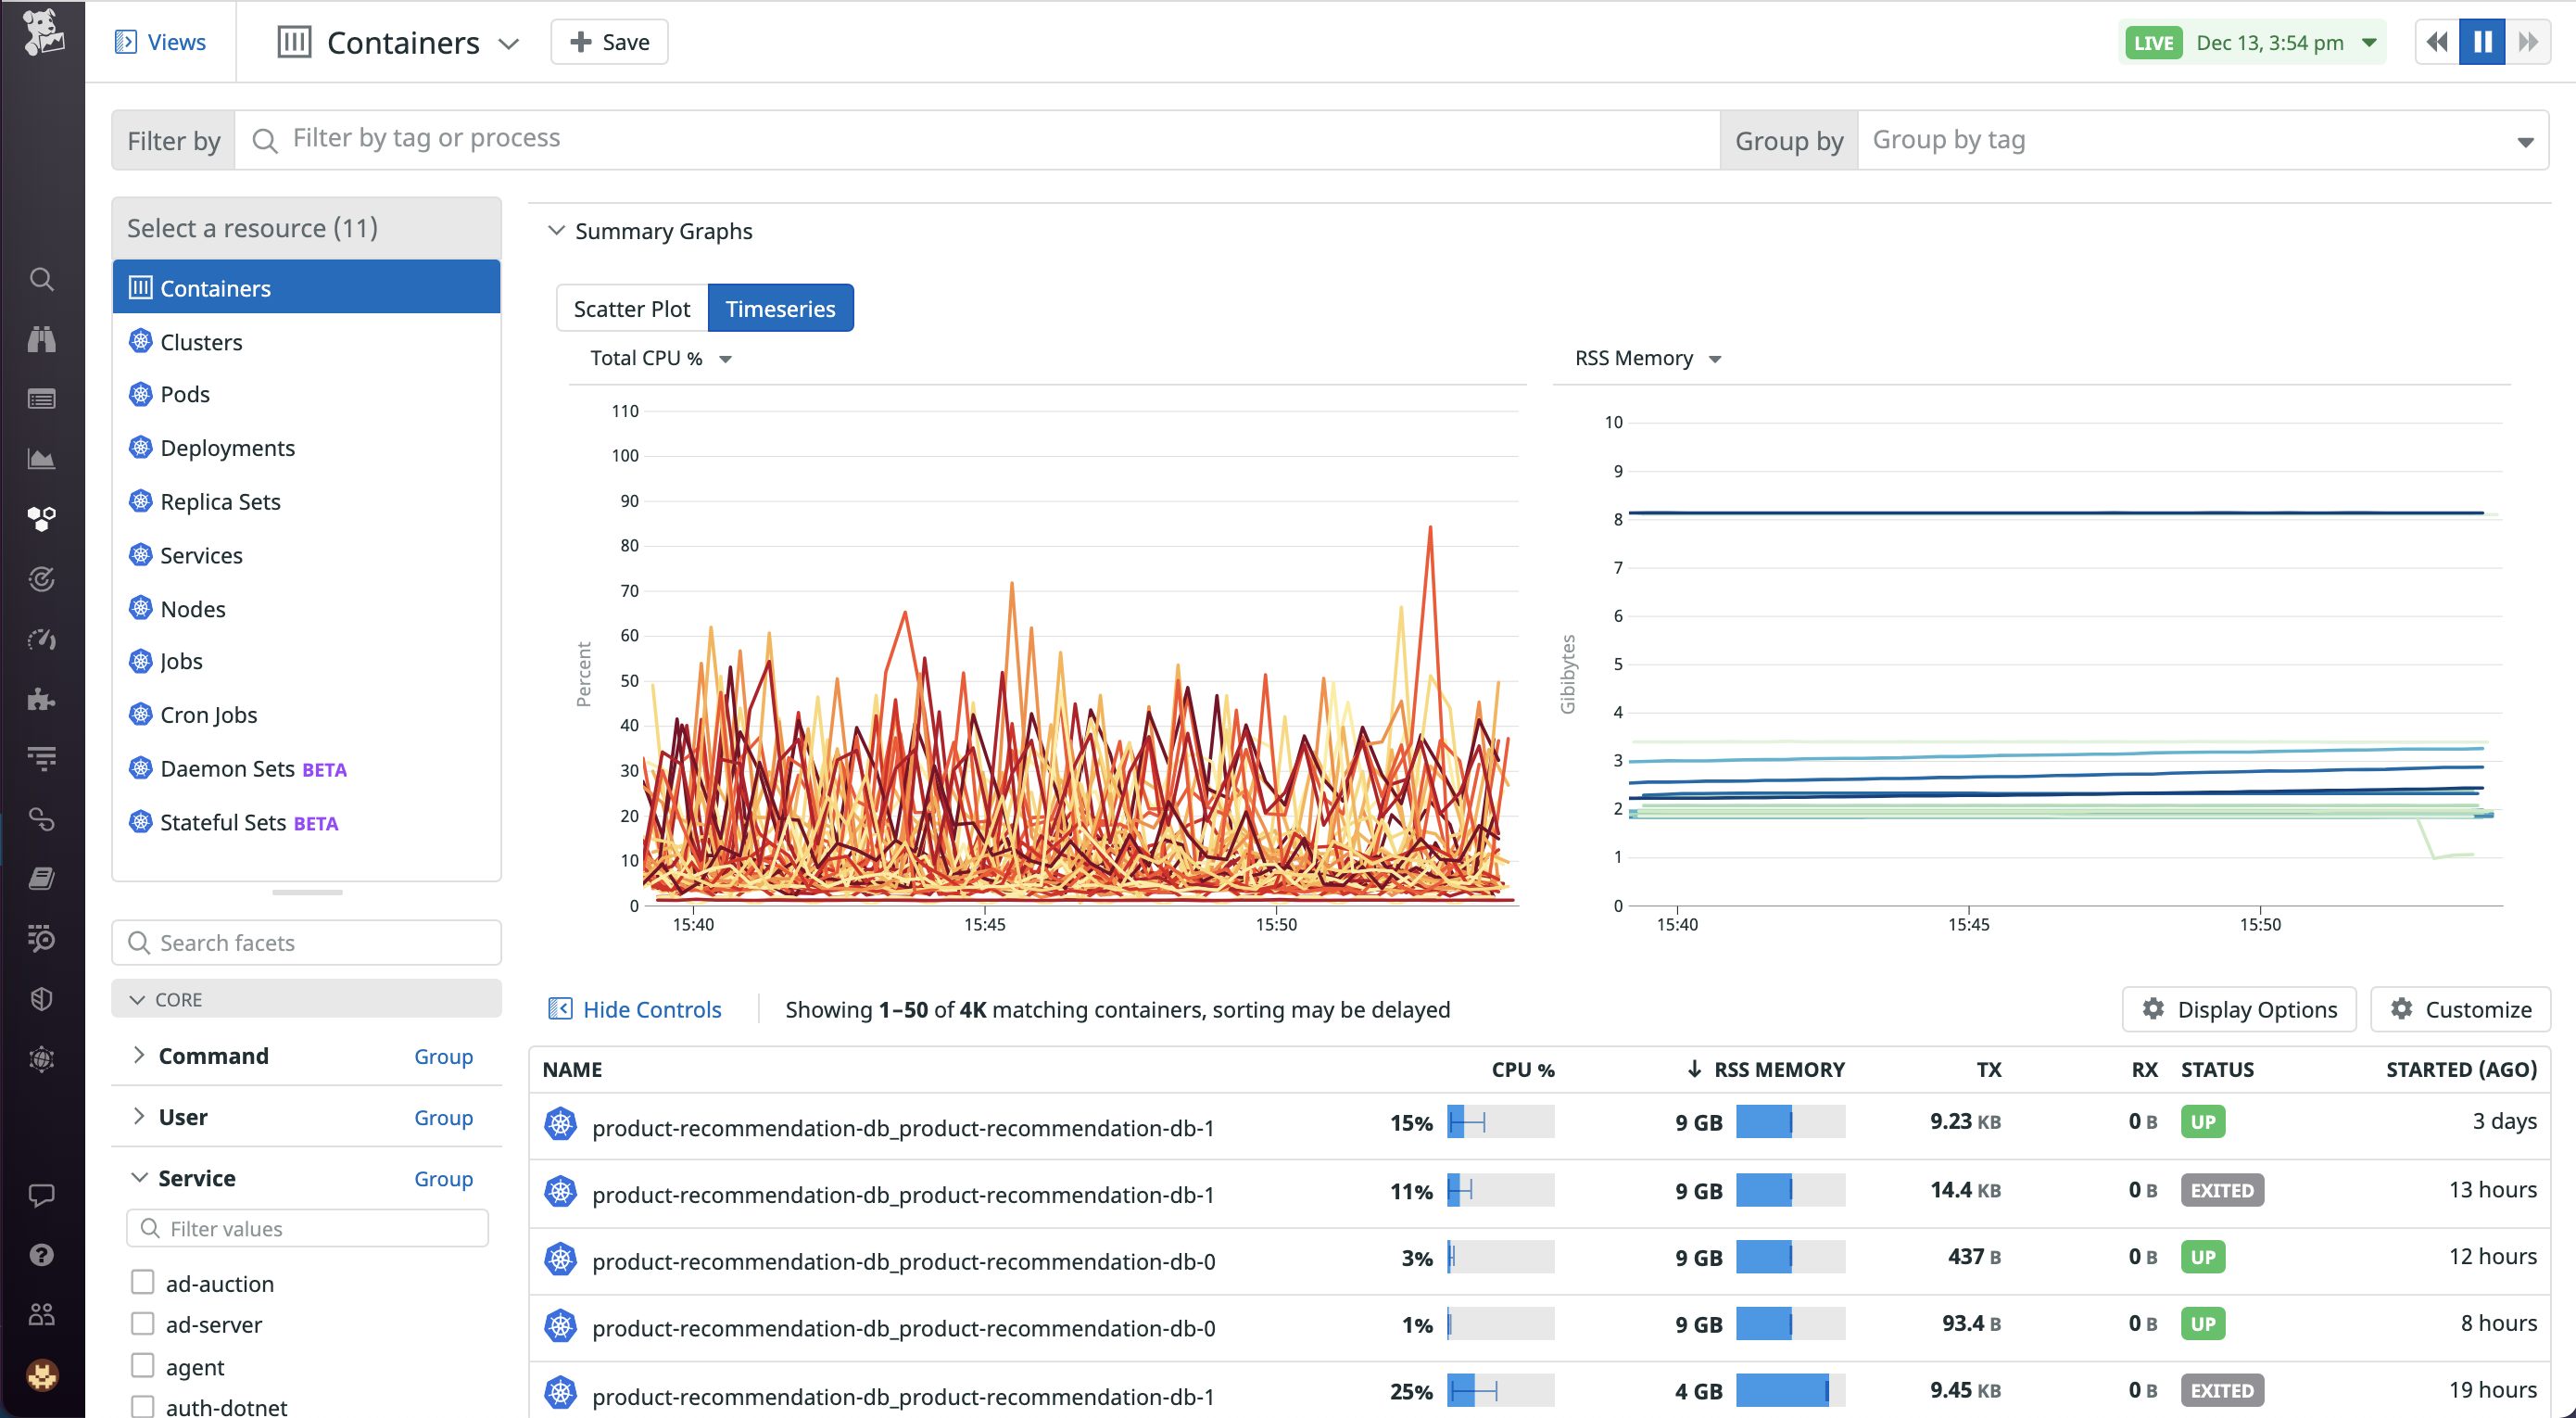
Design custom dashboards to monitor specific aspects of your Azure infrastructure, including resource utilization, request rates, and error rates.
Employ template variables and timeseries widgets for detailed visual representation.
5. Automated Synthetic Monitoring
Develop complex browser tests for your Azure web applications to monitor user journeys and interactions.
Run API tests to ensure your Azure-backed APIs are responding correctly and within acceptable timeframes.
6. Security and Compliance
Monitor the security posture of your Azure resources with Datadog Security Monitoring.
Setup security rules to detect and alert on suspicious activity and potential threats in your Azure environment.
Utilize Compliance Monitoring to ensure your Azure configurations adhere to compliance standards and best practices.
7. Monitoring Azure Kubernetes Service (AKS)
Deploy Datadog Agents on your AKS clusters to monitor node performance, pod status, and Kubernetes events.
Enable Datadog’s APM and Distributed Tracing to gain insights into the performance of applications running on AKS.
Example: Deploy a Datadog agent to your AKS Cluster:
  # datadog-agent.yaml
  apiVersion: apps/v1
  kind: DaemonSet
  metadata:
    name: datadog-agent
  spec:
    selector:
      matchLabels:
        app: datadog-agent
    template:
      metadata:
        labels:
          app: datadog-agent
      spec:
        containers:
          - name: datadog-agent
            image: datadog/agent:latest
            env:
              - name: DD_API_KEY
                value: "<YOUR_DATADOG_API_KEY>"
              - name: KUBERNETES
                value: "yes"
              - name: DD_KUBELET_HOST
                valueFrom:
                  fieldRef:
                    fieldPath: status.hostIP
            volumeMounts:
              - name: dockersocket
                mountPath: /var/run/docker.sock
        volumes:
          - hostPath:
              path: /var/run/docker.sock
            name: dockersocket
Apply the YAML
kubectl apply -f datadog-agent.yaml
8. Custom Integrations and Automations:
Develop custom integrations to bring in data from other tools and services into Datadog.
Use Datadog’s API to automate monitoring tasks, such as dynamically updating monitors and dashboards based on changes in your Azure environment.
Example : Updating a Dashboard Dynamically through API:
You can use the Datadog API to dynamically update dashboards based on changes in your Azure environment:
First, add the necessary NuGet packages to your project:
dotnet add package Newtonsoft.Json//Code to Update Datadog Dashboard using System; using System.Net.Http; using System.Text; using System.Threading.Tasks; using Newtonsoft.Json; // Install Newtonsoft.Json NuGet package class Program { private static readonly string url = "https://api.datadoghq.com/api/v1/dashboard/<DASHBOARD_ID>"; private static readonly string apiKey = "<YOUR_DATADOG_API_KEY>"; private static readonly string appKey = "<YOUR_DATADOG_APPLICATION_KEY>"; static async Task Main() { using HttpClient httpClient = new HttpClient(); // Set up headers httpClient.DefaultRequestHeaders.Add("DD-API-KEY", apiKey); httpClient.DefaultRequestHeaders.Add("DD-APPLICATION-KEY", appKey); httpClient.DefaultRequestHeaders.Add("Content-Type", "application/json"); var payload = new { // Your updated dashboard definition }; string serializedPayload = JsonConvert.SerializeObject(payload); HttpContent content = new StringContent(serializedPayload, Encoding.UTF8, "application/json"); // Send a PUT request to the specified Url HttpResponseMessage response = await httpClient.PutAsync(url, content); if(response.IsSuccessStatusCode) { string responseBody = await response.Content.ReadAsStringAsync(); Console.WriteLine(responseBody); } else { Console.WriteLine($"Failed to update dashboard. Status code: {response.StatusCode}"); } } }
9. APM Integration:
- Set up Application Performance Monitoring (APM) to trace requests across service boundaries.
Monitoring Strategies

1. Resource Utilization Monitoring:
Track CPU, memory, and disk usage of your Azure resources.
Set up alerts for resource overutilization or underutilization.
2. Application Performance Monitoring:
Monitor the response times, error rates, and throughput of your applications.
Identify bottlenecks and optimize your application’s performance.
3. Security and Compliance Monitoring:
Monitor security-related events and compliance with policies.
Set up security alerts and conduct regular audits.
Troubleshooting and Optimization
1. Investigating Issues:
Use Datadog’s troubleshooting tools, such as Trace Search & Analytics and Log Explorer, to investigate issues in your Azure resources.
Correlate logs, traces, and metrics to identify the root cause of issues.
2. Optimization:
Use Datadog’s recommendations and insights to optimize your Azure resources.
Identify underutilized resources and optimize costs by resizing or deallocating them.

Conclusion
Datadog and Azure together offer an unrivaled solution for those seeking to optimize their technological ecosystems. This guide has navigated through the seamless integration of these two platforms, highlighting the potential to enhance observability, improve security, and streamline operations.
By leveraging Datadog’s advanced features with Azure’s robust cloud services, organizations can gain real-time insights, detect anomalies swiftly, and respond to changes efficiently, ensuring the delivery of high-quality applications. This integration is not just a step but a leap towards operational excellence, allowing developers and IT professionals to revolutionize their approach to application development, deployment, and maintenance.
So, embrace this synergistic approach and experience the transformative power of combining Datadog with Azure. Dive deep into unprecedented levels of insights and optimize your workflow like never before. The path to technological brilliance and innovative solutions is now wide open!
Always refer to the official Datadog Documentation and Azure Documentation for the most accurate and up-to-date information.

Thank you for reading this Blog. Hope you learned something new today! If you found this blog helpful, please like, share, and follow me for more blog posts like this in the future.
If you have some suggestions I am happy to learn with you.
I would love to connect with you on LinkedIn
Meet you in the next blog....till then Stay Safe ➕ Stay Healthy
#HappyLearning #devops #Datadog #Azure #CloudComputing #TechStack #ApplicationDevelopment #ITOperations #FullStackObservability #ApplicationPerformance #TechIntegration #OperationalExcellence #AdvancedAnalytics #APIIntegration #Cybersecurity #MachineLearning #CloudSecurity #CloudServices #SoftwareDevelopment #LogManagement #NetworkPerformance
